Численные методы обучения по прецедентам (практика, В.В. Стрижов)/Примеры
Материал из MachineLearning.
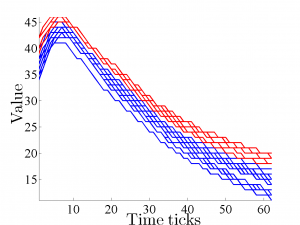
Title: Phosphor curve differences
- Folder: CurveDifferences
- Description: Phosphor curves 0-1 classification illustration. 0-class curve is blue coloured, 1-class curve is red coloured. See more detailed description at demo_curve_differences.html
- Demo script: demo_curve_differences
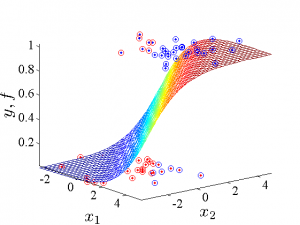
Title: Classification using logistic regression
- Folder: DataGenerationExample
- Description: This demo shows how to compute a separation hyperplane to classify objects. The hyperplane separates one class of objects from another. See more detailed description at demoDataGen.html
- Demo script: demoDataGen
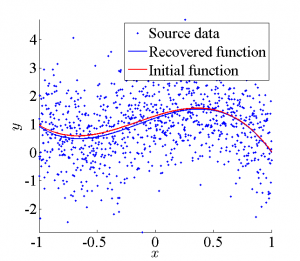
Title: Generalized linear models example
- Folder: GLM
- Description: This demo shows how to deal with the different hypothesis on data generation. The data generation hypothesis here is an assumption about the link function. See more detailed description at demo_GLM.html
- Demo script: demo_GLM
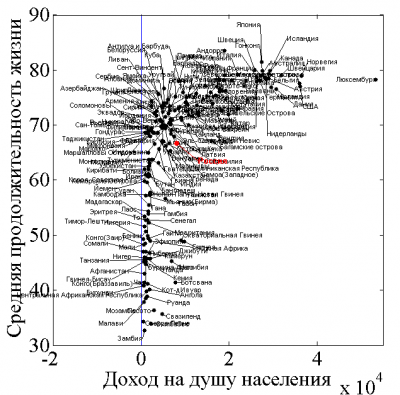
Title: Income vs Lifespan illustration
- Folder: IncomeVsLifeSpan
- Description: Demo illustrates dependence between income and lifespan by countries.
- Demo script: IncomeVsLifespan
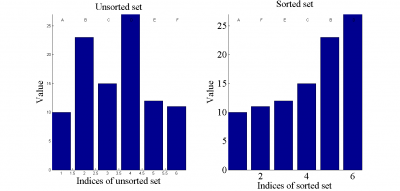
Title: Indexation demo
- Folder: Indexation
- Description: This demo shows how to use indices of sorted sets and how to recover the unsorted set from the sorted one. See more detailed description at demo_indexation.html
- Demo script: demo_indexation
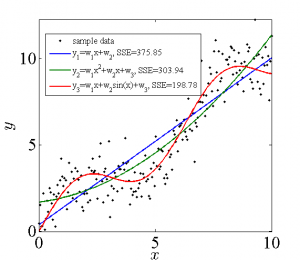
Title: Least Squares Linear Fit
- Folder: LeastSquares
- Description: It shows how to use minimal least squares method to fit data. See more detailed description at demo_least_squares_fit.html
- Demo script: demo_least_squares_fit
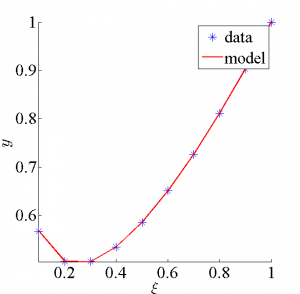
Title: Linear model generation
- Folder: LinearModelGeneration
- Description: The problem of model generation is illustrated with a linear regression model of a single variable. See more detailed description at LinModelGen.html
- Demo script: LinModelGen
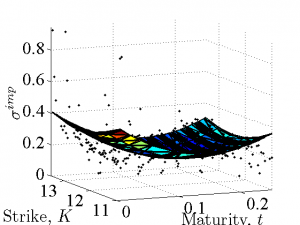
Title: Volatility smile modelling
- Folder: LinfitOptions
- Description: A volatility smile modeling is one of the actual problems in finance mathematics. Here is an example how to make a regression model of the volatility smile using historical data of an option. See more detailed description at demo_linfit_options.html
- Demo script: demo_linfit_options
Title: Logistic regression example
- Folder: LogisticRegression
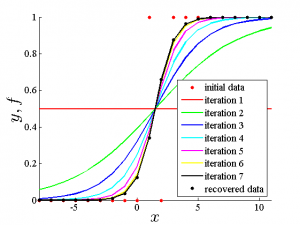
- Description: The Newton-Raphson algorithm is used to obtain the optimal parameters of the regression model. See more detailed description at demo_logistic_regression.html
- Demo script: demo_logistic_regression
Title: Overfitting curve
- Folder: OverfittingCurve
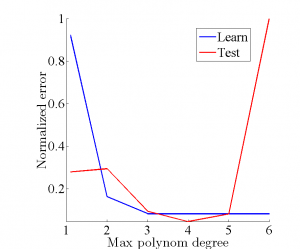
- Description: Demo illustrates errors on learn (blue curve) and test (red curve) depending on model complexity. The test error increasing shows overfitting.
- Demo script: illustrateOvetfitting
Title: Receiver Operating Characteristic example
- Folder: PlotROC
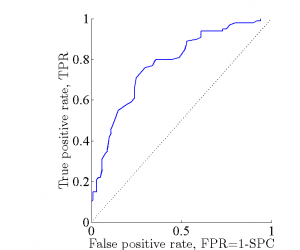
- Description: ROC analysis provides tools to select possibly optimal models and to discard suboptimal ones independently from (and prior to specifying) the cost context or the class distribution. ROC analysis is related in a direct and natural way to cost/benefit analysis of diagnostic decision making. See more detailed description at demo_ROC.html
- Demo script: demo_ROC
