Логистическая регрессия (пример)
Материал из MachineLearning.
|
Логистическая регрессия - частный случай обобщенной линейной регрессии. Предполагается, что зависимая переменная принимает два значения и имеет биномиальное распределение.
На практике логистическая регрессия используется для решения задач классификации с линейно-разделяемыми классами.
Постановка задачи восстановления логистической регрессии
Задана выборка - множество пар
, в
которых описание
-го элемента
, и
значения зависимой переменной
Принята модель логистической регрессии, согласно которой
свободные переменные и
зависимая переменная
связаны зависимостью
где .
Примем обозначения ,
вектор
Для удобства дальнейшего
изложения обозначим выборку свободных переменных как
Требуется найти такое значение вектора параметров ,
которое бы доставляло минимум норме вектора невязок
Алгоритм отыскания оптимальных параметров
Оптимальные параметры отыскиваются последовательно с помощью итерационного метода наименьших квадратов с использованием взвешивания элементов выборки. Приведенный ниже алгоритм основан на алгоритме Ньютона-Рафсона.
В начале работы алгоритма задаются параметры начального приближения:
скаляр ,
где
- среднее значение
выборки зависимой переменной и значения
для
.
Далее итеративно повторяется следующая процедура.
- С использованием вектора параметров
вычисляется переменная
- Вычисляется восстановленное значение выборки зависимой переменной
- Вычисляется вектор значений зависимой переменной для текущего шага линейной регрессии
- вектор весов значений зависимой переменной.
- Решается задача наименьших квадратов с взвешиванием элементов выборки. При этом
больший вес приобретают те элементы, которые имеют большую невязку
где диагональная матрица весов .
Процедура останавливается после того, как норма разности векторов весов
на каждой итерации не будет превышать заданную константу:
.
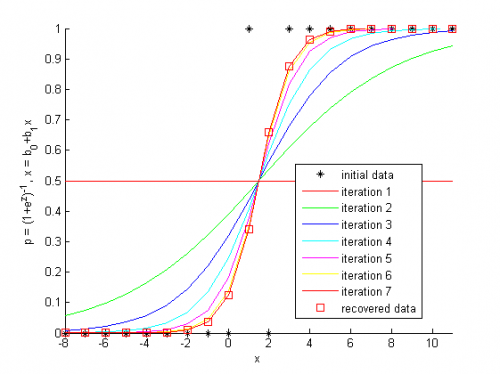
Пример на модельных данных
Перед началом работы алгоритма задаются начальные значения параметров
b0 = log(mean(y)/(1-mean(y))); % 1st element, function of the mean value of y's
b = [b0 zeros(size(X,2)-1)]';  % column-vector of parameters
Итерационное вычисление параметров логистической регрессии
while 1==1
    z = X*b; % the logit^-1 variable is function of parameters
    p = 1./(1+exp(-z)); % recover the regression
    w = p.*(1-p); % calculate the weights of the samples
    u = z + (y-p)./w; % calculate the dependent variable for this step of least squares
    b_old = b; % store old parameters
    b = inv( X'*diag(w)*X ) * X' * diag(w) * u; % calculate new parameters with least squares
    % termanate the iterations if changes of the parameters are small
    if sumsqr(b - b_old) <= TolFun, break; end
end
Исходный код
%% Logistic regression example
% The Newton-Raphson algorithm is used to obtain the optimal parameters
% of the regression model

%% Create a demonstration data set

% independent variable, 20 samples
x = [[-8:1]'; [2:11]'];
% dependent variable of zeros and ones
y = [zeros(9,1); 1; 0; ones(9,1)];
% construct the matrix of independent samples
X = [ones(size(x,1),1) x];

%Plot the initial data

h = figure;
hold on
plot(X(:,2), y,'k*'); hold on
txtlegend = {'initial data'};
colors = {'r-','g-', 'b-', 'c-', 'm-', 'y-'};
ncolor  = 0;

%% Set the constant for iteration convergence

% the algorithm stops when the difference of the parameter is small
TolFun = 10^-3;

%% Define the initial value of the parameters

% 1st element, function of the mean value of y's
b0 = log(mean(y)/(1-mean(y)));
% column-vector of parameters
b = [b0 zeros(size(X,2)-1)]';

%%  The Newton-Raphson procedure

while 1==1
    % the logit^-1 variable is function of parameters
    z = X*b;
    % recover the regression
    p = 1./(1+exp(-z));
    % calculate the weights of the samples
    w = p.*(1-p);
    % calculate the dependent variable for this step of least squares
    u = z + (y-p)./w;

    % plot the results of this step
    plot(x, p, colors{mod(ncolor,length(colors))+1});
    ncolor = ncolor + 1; % change color
    txtlegend{end+1} = ['iteration ', num2str(ncolor)];

    % store old parameters
    b_old = b;
    % calculate new parameters with least squares
    b = inv( X'*diag(w)*X ) * X' * diag(w) * u;

    % termanate the iterations if changes of the parameters are small
    if sumsqr(b - b_old) <= TolFun, break; end
end

%%  Show the result

% claculate recovered dependent variable
p = 1./(1+exp(-X*b));
% plot the result
txtlegend{end+1} = 'recovered data';
plot(x, p,'rs');
legend(txtlegend);
axis tight
xlabel('x');
ylabel('p = (1+e^z)^{-1}, x = b_0+b_1x');

%% Notes
% In Matlab there are glmfit and glmval functuions. Use them for
% professional purposes.

return
Смотри также
- Линейная регрессия (пример)
- Логистическая регрессия
- Регрессионный анализ
- Метод наименьших квадратов
- Обобщенная линейная модель
- Алгоритм Ньютона
- Алгоритм Ньютона-Рафсона
- Эта статья в формате PDF
Литература
- Hastie, T., Tibshirani, R., Friedman, J. The Elements of Statistical Learning, 2nd edition. — Springer, 2009. — 533 p. (подробнее)


