Численные методы обучения по прецедентам (практика, В.В. Стрижов)/Примеры
Материал из MachineLearning.
(Различия между версиями)
(→Title: Income vs Lifespan illustration) |
|||
| Строка 2: | Строка 2: | ||
*''Folder:'' CurveDifferences | *''Folder:'' CurveDifferences | ||
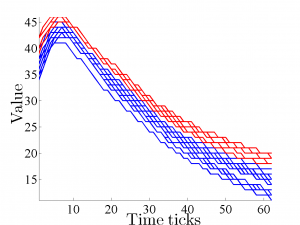
*''Description:'' Phosphor curves 0-1 classification illustration. 0-class curve is blue coloured, 1-class curve is red coloured. See more detailed description at demo_curve_differences.html | *''Description:'' Phosphor curves 0-1 classification illustration. 0-class curve is blue coloured, 1-class curve is red coloured. See more detailed description at demo_curve_differences.html | ||
| - | *'' | + | *''Demo script:'' demo_curve_differences |
[[Изображение:Phosphor1.csv.png|300px]] | [[Изображение:Phosphor1.csv.png|300px]] | ||
| Строка 8: | Строка 8: | ||
*''Folder:'' DataGenerationExample | *''Folder:'' DataGenerationExample | ||
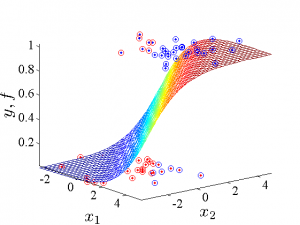
*''Description:'' This demo shows how to compute a separation hyperplane to classify objects. The hyperplane separates one class of objects from another. See more detailed description at demoDataGen.html | *''Description:'' This demo shows how to compute a separation hyperplane to classify objects. The hyperplane separates one class of objects from another. See more detailed description at demoDataGen.html | ||
| - | *'' | + | *''Demo script:'' demoDataGen |
[[Изображение:ModelLogit.png|300px]] | [[Изображение:ModelLogit.png|300px]] | ||
| Строка 14: | Строка 14: | ||
*''Folder:'' GLM | *''Folder:'' GLM | ||
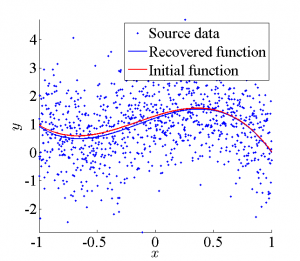
*''Description:'' This demo shows how to deal with the different hypothesis on data generation. The data generation hypothesis here is an assumption about the link function. See more detailed description at demo_GLM.html | *''Description:'' This demo shows how to deal with the different hypothesis on data generation. The data generation hypothesis here is an assumption about the link function. See more detailed description at demo_GLM.html | ||
| - | *'' | + | *''Demo script:'' demo_GLM |
[[Изображение:Demo GLM 1.png|300px]] | [[Изображение:Demo GLM 1.png|300px]] | ||
| Строка 20: | Строка 20: | ||
*''Folder:'' IncomeVsLifeSpan | *''Folder:'' IncomeVsLifeSpan | ||
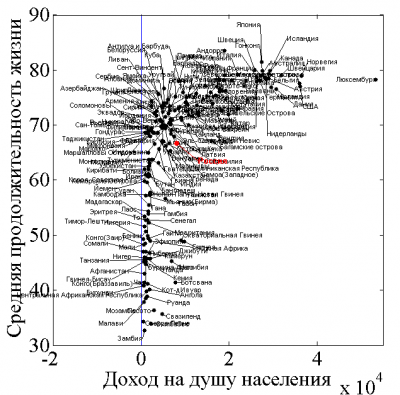
*''Description:'' Demo illustrates dependence between income and lifespan by countries. | *''Description:'' Demo illustrates dependence between income and lifespan by countries. | ||
| - | *'' | + | *''Demo script:'' IncomeVsLifespan |
[[Изображение:lifespan.png|400px]] | [[Изображение:lifespan.png|400px]] | ||
Версия 13:26, 6 июня 2013
Содержание |
Title: Phosphor curve differences
- Folder: CurveDifferences
- Description: Phosphor curves 0-1 classification illustration. 0-class curve is blue coloured, 1-class curve is red coloured. See more detailed description at demo_curve_differences.html
- Demo script: demo_curve_differences
Title: Classification using logistic regression
- Folder: DataGenerationExample
- Description: This demo shows how to compute a separation hyperplane to classify objects. The hyperplane separates one class of objects from another. See more detailed description at demoDataGen.html
- Demo script: demoDataGen
Title: Generalized linear models example
- Folder: GLM
- Description: This demo shows how to deal with the different hypothesis on data generation. The data generation hypothesis here is an assumption about the link function. See more detailed description at demo_GLM.html
- Demo script: demo_GLM
Title: Income vs Lifespan illustration
- Folder: IncomeVsLifeSpan
- Description: Demo illustrates dependence between income and lifespan by countries.
- Demo script: IncomeVsLifespan


